15 October 2018
One of the difficulties of risk premia analysis is that the concept of risk premium is somewhat ambiguous. For a given asset class, there are at least four risk premia that can be analyzed (“historical”, “spot”, “valuation”, “embedded”). When market participants or academics discuss the dynamic of risk premia, it is not always clear which one among the four they are discussing. We consider the following typology as an important prerequisite in order to discuss accurately what is really going on in the markets.
1/ The “historical” risk premium.
Risky assets need to provide investors with an excess return relative to a risk-free interest rate. Indeed, one can observe over long periods of time that investors can get much higher returns by accepting to bear some investment risk. There are many alternative sources to evaluate these “historical” risk premia[1]. Here is a table coming from a recent fascinating paper which provides until the year 2015 a new and comprehensive database on the total annual rate of return of four major asset classes across 16 advanced economies, since 1870 (“The rate of return on everything, 1870–2015”, by Òscar Jordà, Katharina Knoll, Dmitry Kuvshinov, Moritz Schularick and Alan M. Taylor, available as NBER Working Paper No. 24112 or Federal Reserve Bank of San Francisco Working Paper No. 2017-25).
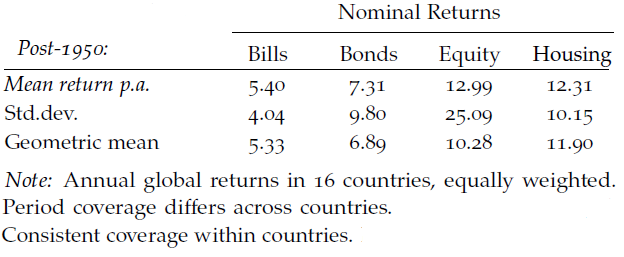
Over the 1950-2017 period, the “historical” risk premium has been close to 5% per annum on the global equity market and 1 1/2% for the global government bond market (excess return relative to the risk-free interest rate measured by the return provided by Treasury bills). Obviously, these “historical” risk premia have been anything but stable. Markets have been hit by shocks and surprises, both negative and positive, and as a result, ex post excess returns have been highly volatile, even measured over a 10-year period. Thus, it could be very misleading to believe that “historical” risk premia on a relatively short period of time provide an accurate measure of the true risk premia investors were requiring ex ante to bear the various financial risks.
Yet, it is not unreasonable to believe that over a very long period, for example the almost six decades described in the preceding table, positive surprises and negative surprises may broadly compensate for each other. In other words, it is not unreasonable to believe that the preceding orders of magnitudes (5% for equities and 1 1/2% for long-term government bonds) provide a good approximation of the true ex ante risk premia which were required on average by investors during all these years.
This true ex ante risk premium that we may be indirectly measuring in this table is what we call the “spot” risk premium. We’ll see that it plays a key role in finance textbook, but it is not directly observable: thus, it seems very nice to get some indications on where it stood in the past!
Yet, unfortunately we’ll insist many times on a key point which will sharply reduce the interest of calculating “historical” risk premia: these “spot” risk premia seem rather volatile, especially as far as bonds and currencies are concerned. For perfectly rational reasons, on some assets, even the sign of the “spot” risk premia may change over time! Thus the “historical” risk premia we have just discussed look like rather crude backwards looking indicators. Indeed, these historical statistics may lead some analysts to a very inaccurate assessment of the current and future demands of investors (more on that later when we’ll discuss the notions of “valuation” and “embedded” risk premium).
2/ The “spot” risk premium.
As we have just discussed, the “spot” risk premium is the short term expected excess return that is required at any point in time by the average investor to balance supply and demand. Sometimes, we call it equivalently the “tactical” risk premium (see our daily comments on the US Treasuries market).
In mathematical terms, if E(zit) is the expected return (for an average investor) between the date t and t+1 for the risky asset i, and rt the risk-free rate over this period (for example one year), the “spot” risk premium is E(zit)- rt. The “spot” risk premium plays a key role in theoretical finance. For example, the famous CAPM model is a normative theory about the relationship between the market “spot” risk premium E(Mt)-rt and the “spot” risk premium for a specific asset E(zt)- rt :![]() . In all valuation models, current prices depend heavily on where the “spot” risk premia stand now and how they are expected to behave in the future (more on that next when we’ll introduce the “valuation” risk premium).
. In all valuation models, current prices depend heavily on where the “spot” risk premia stand now and how they are expected to behave in the future (more on that next when we’ll introduce the “valuation” risk premium).
Unfortunately, there is a fundamental problem of missing information concerning the “spot” risk premia. We all know our own “spot” risk premia (or at least we should…), i.e. how optimistic we are when we decide to invest on various risky securities. Yet, we don’t know precisely what other people believe and, on an aggregated basis, what are investors’ average “spot” risk premia. Often, private and asymmetric information trigger so-called “market failures” and we believe this one is no exception: it’s hard to value correctly financial assets without an accurate view on the “spot” risk premia required by investors (more on that later).
Yet, there are many surveys that try to reduce this asymmetry of information by tracking investors or economists’ expectations regarding future prices. It is then possible to extract the implicit returns that they expect. By comparing these implicit expected returns with the risk-free rate, it is possible to get some insight into the “spot” risk premia at a specific point in time. These surveys have their flaws (for example there are often based on a relatively small number of respondents[2]), but the results are often very interesting.
To illustrate this point, look at the following graphs based on the monthly surveys done over three decades by “Consensus Economics“. They allow a first discussion on a very topical issue: how has evolved over time the risk premia on benchmark government bonds (10-year rate). The first two graphs compare the observed rates at the time of the survey and the one-year ahead forecasts.
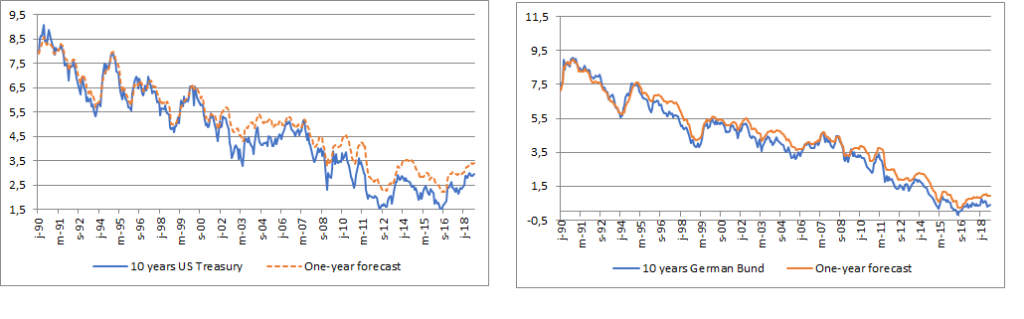
We observe that starting 20 years ago in the US, and maybe a bit earlier in Germany, the consensus among investors has been (generally wrongly…) that long-term rates will rise in the coming year. This is a rather puzzling observation since rising yields generally lead to capital losses on bonds’ holdings. How a market for a so-called risky asset can find an equilibrium with investors expecting making losses?
Obviously, the answer may be that no losses were in fact expected since maybe the long-term interest rates were high enough to absorb the impact of (expected) rising rates. In most of this period, bond holders benefitted from a yield curve with a positive slope. Thus, the investors in long-term bonds benefitted from higher rates than on short-term instruments[3]. The following two graphs take into account the slope of the yield curve and extract from these surveys the “spot” risk premia on bonds (excess expected return relative to a one-year investment in the monetary market). As these estimates are quite volatile, we have added two-year moving averages.
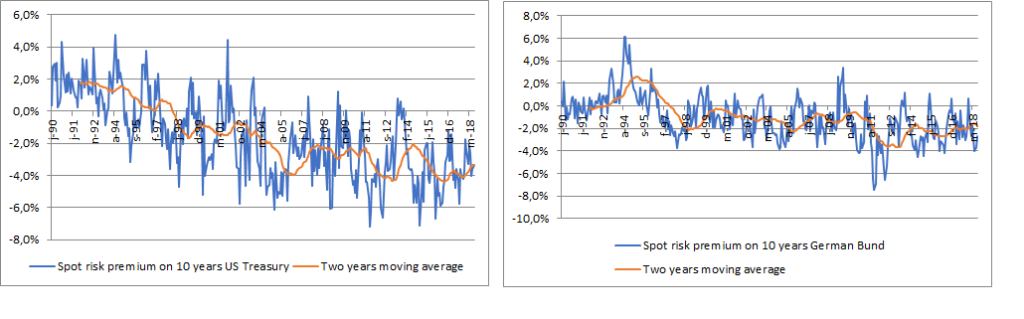
The result seems clear: taking into account the shape of the yield curve does not solve the puzzle! For most of this period, investors were apparently expecting to lose money by holding long-term bonds rather than short-term instruments. In the US, a long-term trend towards lower “spot” risk premia appeared as soon as the 1990s. In some way, the expectations surveys were able to send a very powerful message about the pricing of bonds much earlier than other approaches (we discuss this point in details in Why Risk Premia Vary and Has the Duration Risk Premia Turned Negative ).
3/ The “valuation” risk premium.
The “valuation” risk premia are the risk premia used by “fundamentalist” investors to assess what are the right prices for the various assets’ prices. All fundamental valuation models are based on an arbitrage hypothesis: current prices should be such that if the valuation risk premium is higher by 1% on a given asset, its expected long-term return should be also 1% higher.
What is the link between these “valuation” risk premia and the “spot” risk premia we have just discussed?
Suppose that you are a “fundamentalist” investor who spends a lot of time trying to overcome the natural asymmetries of information, and the limits of the available surveys, to get an accurate measure of the “spot” risk premia. How should you use your estimates as input in the fundamental valuation models that we have learnt at school (i.e. the discounted cash flows model for equities, the expectations model for bonds and the overshooting model for exchange rates)?
In financial theory, the answer is rather straightforward. All fundamental valuation models are forward looking: the current price should be such that current investors, but also the future generations of investors, are likely to receive an adequate compensation for the risks that they support or will likely support. Suppose that, for whatever reasons, investors are not currently risk adverse (i.e. the “spot” risk premium is low) but that they are likely to raise sharply in the future the return they require on the asset under consideration. Then, the current price should be low if current investors are rational and anticipate correctly a much lower demand for this asset in the future. To give a practical example, the exchange rate of a country with a rising external debt should reflect as soon as today the rising risk premium that future foreign lenders will sooner or later require. Or, relying again on a more topical issue, the rational impact of Quantitative Easing (i.e. the buying of bonds by central banks) on long-term rates depends crucially on how long this policy is expected to last. Central banks’ purchases push downwards the “spot” risk premium on bonds (as private investors have less supply to absorb), but at the long-end of the yield curve, bond prices should incorporate the end of this policy and the fact that at some stage future investors are likely to be more demanding.
Thus, it is important to recognize that the “valuation” risk premium to be used in a fundamental valuation model is NOT the current “spot” risk premium. Current prices should incorporate the most rational expectations that investors could form on the future path of “spot” risk premia. As a result, the “valuation” risk premium should be an average of all the future expected “spot” risk premia[4]. In this respect, risk premia are not different from the other inputs playing a role in fundamental valuation models. As far as equities are concerned, the important profits are obviously not the short-term profits, but rather all the expected profits far into the future. As far as bonds (expectations model) or currencies (the overshooting model) are concerned, prices should depend on the entire expected future path of short-term interest rates, not on the current and temporary stance of monetary policy. The same can be said of risk premia.
It is maybe why most investors don’t care a lot about “spot” risk premia and are happy to use instead “historical” risk premia to value assets. They probably have the view that the vagaries of the “spot” risk premia have little significance if they are mean-reverting towards “normal” risk premia more or less measured by the “historical” risk premia. Yet, by equalizing “historical” and “valuation” risk premia, they are ignoring the signals sent by expectations survey at their own risk! As suggested by the preceding graphs, “spot” risk premia may experience structural breaks and “historical” risk premia may be a rather poor guide of how future investors will behave.
In other words, the “valuation” risk premia used by most investors may be too rigid and lead to inaccurate pricing (more on that later…).
4/ The “embedded” risk premium.
Finally, when risk premia are mentioned, one is often referring to the “embedded” risk premia, that we often call in our work the “buy-and-hold” risk premia.
In some way, these “embedded” risk premia result from an operation of reverse engineering! Analysts can look at current prices and based on their long-term forecasts for other fundamental variables (corporate profits, short-term interest rates controlled by central banks, purchasing power parities as far as currencies are concerned) they may extract the risk premia embedded in the current prices. These “embedded” risk premia are the excess returns that a long-term investor can reasonably expect over his long-term horizon when it buys at the current prices (conditional to his scenarios concerning other fundamentals).
The “embedded” risk premia results from an economic analysis of the long-term trend. They depend crucially on the current prices, i.e. whether prices are considered cheap or expansive. They change either because assets prices change or because new information convince the analysts to change their central scenarios on the fundamentals (again profits, monetary policies….)[5].
The “valuation” risk premia that we have described previously are estimated using a radically different approach: based on whatever information they deem appropriate (“historical” risk premia, expectations surveys, theoretical models of portfolio choice like the CAPM….), analysts try to assess the risk aversion of investors in the future and the excess returns they are likely to require on various asset classes.
The comparison of these two sorts of risk premia is what should allow fundamentalist investors to assess whether markets are fairly valued. If the “embedded” risk premium is above the “valuation” risk premium, the asset under consideration will be considered cheap: it is expected to provide a return which is above what investors are supposed to really require. Conversely, if the “embedded” risk premium seems low compared to the “valuation” risk premium, the asset is deemed expansive.
Thus, it should be clear that even if the analysts don’t use this vocabulary (“embedded” versus “valuation”), they need these two different approaches to judge whether or not assets’ prices are aligned with fundamentals.
Yet, proponents of the efficiency of financial markets would probably object that arbitrages ensure that assets’ prices cannot stay away from fundamentals for a very long period. In other words, for them the discrepancy between the “embedded” and “valuation” risk premia can be only small and time limited. Thus, there may be useless to “reverse engineering” asset prices in order to extract the “embedded” risk premia. You only have to estimate the “valuation” risk premia, i.e. to assess what sort of excess return investors will require. And to facilitate your job as an investor, you may add a second trick: if you believe that these required excess return are relatively stable (i.e. mean reverting), you simply must look at “historical” risk premia to get a reasonable estimate of the sort of return you can get in the future.
Finally, the dual hypothesis of market efficiency and mean-reverting “spot” risk premia provides the perfect cover for the most dangerous way of investing: extrapolating past returns into the future!
Indeed, both hypothesis behind this common trick are clearly false:
- “Spot” risk premia vary for long periods of time and may indeed experience structural breaks as previously discussed. That’s too bad, but the accurate “valuation” risk premia cannot be extracted simply from data on “historical” risk premia.
- Moreover, as far as the pricing of risk is concerned, the efficiency of financial markets has been so far a fantasy… Maybe the situation will improve in the future (more rational risk premia investing may help…), but it is not difficult to illustrate that markets can become ludicrously cheap or expensive. In other words, the “embedded” risk premia are often not what they should be!
In our view, there is a strong connection between these two unpleasant phenomena, i.e. the volatility of “spot” risk premia and the vagaries of the “embedded” risk premia. This will be explained in another background paper (Why Risk Premia Vary?). But for the time being, our key point here is that when analysts or academics speak about “risk premia” they should always specify which one there are discussing: “historical”, “spot”, “valuation” or “embedded”? Indeed, a good understanding of the differences between these four key concepts may be a first step towards better functioning financial markets….
[1] See for example, Dimson, Elroy, Paul Marsh, and Mike Staunton. 2002. Triumph of the Optimists: 101 Years of Global Investment Returns. Princeton, N.J.: Princeton University Press. This work is updated every year in The Credit Suisse Global Investment Returns Yearbook.
[2] There are at least two other reasons why surveys may sometimes lead to an imprecise estimate of the average “E(zit)- rt” across investors. Firstly, respondents often give their most likely scenario: when risks are not symmetric around this central forecast, their answers will lead to a biased estimate of E(zit). Secondly, when financial markets’ economists are questioned, they often give their official forecast as published in the latest newsletter. When prices have recently moved significantly, their last official forecast may no longer reflect their true expectations.
[3] Moreover, 10-year bonds will become 9-year bonds in 12 months. Thus, to estimate the expected capital gains or losses one-year ahead one must take into account the difference of yield between 9- and 10-years rates.
[4] We’ll not discuss here how this average should be done, i.e. the relative weight of the current “spot” risk premium and the expected “spot” risk premia in the future. It depends on the specific characteristics of the asset under consideration.
[5] We can note that investors obviously often disagree about the “embedded” risk premia since they don’t share the same scenarios for the pertinent fundamental variables. Thus, analysts are often looking at the average “embedded” risk premia by using not their own scenario on fundamental variables, but the “consensus” scenario in the market as revealed by various surveys. This extraction of the average “embedded” risk premia may be facilitated using financial models. This approach has been particularly developed to estimate the embedded risk premia in the bond market. We discuss how it can be done, and some drawbacks, in the background paper describing our yield curve model (see also “Term premia models and some stylized facts” from the BIS for a recent presentation of this approach).