1st November 2018
The variation of risk premia is generally considered as a major source of financial markets’ volatility. Indeed, in our yield curve models, we find that broadly 50% of the changes in long-term interest rates are due to changes in risk premia (the other half is due to changes in expectations regarding monetary policy).
In this background paper, we intend to discuss the complex reasons why risk premia vary. In doing that, it is important to differentiate between the different concepts of risk premia that are commonly used (see the presentation of The Four Risk Premia). We’ll start by “the mother” of all risk premia: the “spot” risk premia (i.e. the short-term expected excess returns) which eventually drive in a complex way how the other sorts of risk premia (“valuation”, “embedded” and “historical”) move over time.
Why the “spot” risk premia vary?
There are many reasons why “spot” risk premia vary. Some changes are transitory and have no reason to impact significantly the “valuation” and “embedded” risk premia (more on that later). However, other changes are structural and have a major impact on how assets are priced (or should be priced).
There is first a determinant common to all the assets classes. “Spot” risk premia depend on the general risk aversion of investors and how they assess the systemic risks threatening their wealth. Investors may be worried about their future situation and require across most asset classes a high “spot” risk premium. In the Capital Asset Pricing Model (CAPM) this factor common to all “spot” risk premia is called the “market risk premium”.
Yet, there are many specific factors which can explain that risk premia on specific assets classes may vary a lot independently of the “market risk premium”. We’ll mention three key factors: correlation, supply and structural demand shifts.
Correlation
The main lesson of the CAPM is that correlations should be a key driver of the required “spot” risk premia. The reason is simple: when you increase the weight of a specific asset in your portfolio, the impact on your overall level of risk depends crucially on correlations. If the return on this specific asset is highly correlated to the return on the other assets you already hold, your risks increase by investing more on this asset. Yet, just the opposite is true if the correlation is negative: an asset which tends to rise in price when others fall is a very attractive proposition since holding it reduce the global level of risk. A negatively correlated asset should have a negative “spot” risk premium since it provides some sort of insurance. This negative “spot” risk premium can then be considered as a sort of insurance premium willingly paid by investors1.
The role played by correlations is a key reason why “spot” risk premia vary. Many asset classes have time-varying correlations relative to the investors’ global level of wealth.
For example, the correlation between bond prices and equities is nothing but stable. The graph below represents how the correlation has changed over time in the US2.
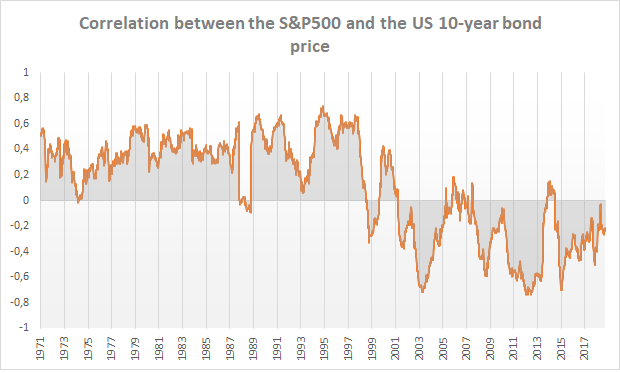
There have been times of extremely high positive correlations (bond prices fall when equities decline), with a peak at 0,74 in 1994, and time of extremely high negative correlations, with a minimum at -0,73 in 2011. On top of some extreme and brutal changes of correlation that are progressively corrected, there has been a clear break at the end of the 1990s with the correlation becoming on average negative (-0,32 in 2001-2018) while it was on average positive before (0,36 in 1971-2000). This change of correlation goes a long way to explain why the “spot” risk premia on bonds have collapsed over this period (see Has The Duration Risk Premium Turned Negative?).
Why did this shift take place? It is probably due to the changing nature of the economic risks born by investors. Indeed, the correlation between bonds and equities depends a lot on the nature of the shocks that move markets.
An extreme situation is when the markets are on a “risk-on/risk-off” mode, for example when investors are worried by some systemic threats (run on the banking sector, risk of disintegration of the euro-zone, trade wars…). In these situations, bad news relative to the systemic threat will trigger sharp falls of the equity market, but may favor the safest assets (US treasuries, German bunds…). As a result, in this kind of situation, the “spot” risk premia on the safest bonds can become significantly negative as they provide a sort of short-term insurance against the current risks3.
Symmetrically, surprises on the inflation front generally move bonds and equities in the same direction: higher consumer prices than expected are always bad for bonds for obvious reasons and one can observe that they are generally bad for equities as well. Thus, uncertainty about inflation tends to increase the “spot” risk premium on bonds. It is particularly true in countries where central banks are not very credible and where inflation can get out of control.
We can also note that the normal correlation between bonds and equities due to the risk of inflation can exceptionally break down when investors fear a deflationary situation. For many decades, it was a forgotten risk, but it reappeared in the aftermath of the great 2008-2009 financial crisis. In a deflationary situation, higher prices than expected are still bad for bonds, but sometimes good for equities. As a result, a deflationary situation may justify a negative risk premium on bonds.
Last but not least, what can be said on the correlation between bonds and equities resulting from surprises on the level of economic activity? In this case, there is a fundamental ambiguity. Higher than expected economic activity is always bad for government bonds, as it may lead to tighter monetary policy. As far as equities are concerned, it depends a lot on the amount of slack available in the economy. If the economy has the potential to operate at a higher level (i.e. there is a relatively high unemployment rate and some unused capital), a good surprise as far as economic growth is concerned will have a positive impact on equities as investors will expect higher profits (and the lack of inflation risks may limit the rise in interest rates). Thus, the “spot” risk premium on government bonds could be pushed in negative territory (negative correlation between bonds and equities). But if the economy is close to overheating, it is likely that higher output will take its toll on the equity market as the potential for higher profits will be limited and investors will fear the impact of higher interest rates. Thus, in this sort of environment, the “spot” risk premium on bonds should be rather positive.
These observations help to understand why the correlation between bonds and equities appears to be so unstable, and why it may have turned on average negative after the year 2000, in a context characterized by various episodes of financial instability and the risk of deflation after the 2008-2009 financial crisis.
The kind of analysis that we have just done for bonds could also be done for currencies. The nature of shocks will also determine the correlation between exchange rates and the overall wealth of investors, with immediate consequences on the “spot” risk premia. For example, as far as the $/€ exchange rate is concerned, the correlation with equity markets has been quite volatile4.
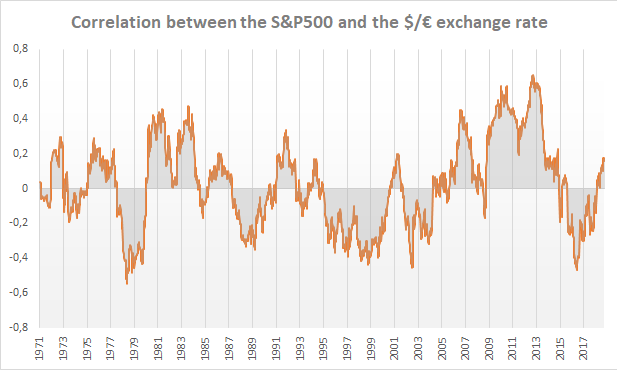
When the worries are more on the European side, there is a positive correlation between the euro and equity markets. It was especially strong in the year 2010-2013 at the peak of the euro crisis (i.e. worries about the strength of the monetary union were pushing lower both the euro and most equity markets). But there were many other periods where the worries were more on the US side and the correlation was negative (i.e. bad news about the US pushed higher the euro and lower most equity markets). Logically, the “spot” risk premium on the $/€ rate should depend a lot on where the correlation stands at a specific point of time. Yet, this risk premium should also be highly dependent on the other key determinants of “spot” risk premia than we are now going to discuss.
Supply
The more investors have to absorb a risky asset class, the more “excess return” they will require. There can be too much of a good thing: an asset class may appear attractive from an apparent correlation point of view (i.e. its return seems negatively correlated to the return of most other risky asset classes), but the size of the risk investors have to absorb is such that there is a positive “spot” risk premium5
Changes in the supply that investors have to absorb play a particularly important role for bonds and currencies.
- A bigger public debt should lead to an increase of the “spot” risk premium even if the risk of the sovereign default eventually stays negligible. Investors’ total wealth is more exposed to the risk of rising interest rates (as the market value of the public debt would fall) and need to be compensated for that. Symmetrically, Quantitative Easing (i.e. the buying of bonds by the central bank) is expected to lower the “spot” risk premium since it reduces the amount of long-term bonds investors have to buy.
- In the same spirit, a higher external debt will increase the “spot” risk premium on the currency of the indebted country as investors will have to bear more exchange rate risk6.
Structural demand shifts
When analyzing changes in “spot” risk premia, it is also very important to take into account the fact that structural changes may affect the way investors manage their portfolios. Here are a few selected factors that are NOT taken into account in the CAPM model and yet should be looked after:
Investment horizon
For long-term investors, investing in short-term bills is NOT risk-free (contrary to the fundamental assumption behind the CAPM model). There is no apparent short-term risk on bills, but looming in the background there is a huge reinvestment risk as the future dynamic of short-term interest rates far into the future is highly uncertain. For long-term investors, the risk-free investment is a long-term highly rated government bond indexed on inflation. And when central banks are credible and inflation expectations are well anchored, traditional nominal long-term bonds are close substitutes to this risk-free investment.
Then, a lengthening of the average investment horizon, linked for example to an increase in pension savings, should increase the demand for long-term bonds. It is even possible (the UK?) that the demand for bonds coming from long-term investors may be such that it pushes the “spot” risk premium into negative territory independently of the correlation we have previously discussed.
Public policies
Public policies could also affect the structural demand for various financial assets and trigger changes in the “spot” risk premia that balance supply and demand. For example, the government can introduce some tax advantages for some investments. Or the regulators can constrain how financial institutions (banks, insurance companies, pension funds) bear financial risks. Last but not least, as far as exchange rates are concerned, governments may or may not control international capital flows.
Asset allocation processes
Finally, the asset allocation process may change over time with some large consequences on the demand addressed to various asset classes. For example, “benchmarked” diversified funds make fund managers prisoners of their benchmarks: even if they don’t like the “spot” risk premium they can get on some risky assets, they may find very dangerous to stop investing. Contrary to the assumptions standing behind the CAPM model, the treasury bill is not the risk-free investment for a benchmarked investor.
Thus, the demand for some expansive assets is sometimes artificially boosted by the “tyranny” of benchmarks. Benchmarks can create a huge gap for some assets between the supply and the constrained demand coming from benchmarked investors. For example, how is the market supposed to absorb Quantitative Easing if central banks buy bonds, but most asset managers are refrained by their benchmarks to sell their bonds? In some way, the “spot” risk premia can become rather extreme, in positive or negative territories, to convince the benchmarked investors to accommodate the changes in supply. “Total return funds” operating without explicit benchmarks have other drawbacks but they give more flexibility to the fund managers.
A shift from “benchmarked” to “total return funds” is thus likely to have some significant impact on the demand for various assets and the “spot” risk premia required by the average investor to hold the available supply.
At the end of the day, for all these reasons, there is little doubt that the “spot” risk premia required by investors to balance the markets at every point in time are rather unstable. Moreover, many factors that have just been discussed have the potential to trigger long-term trends rather than short-term high-frequency volatility. For example, an increase in supply (large public or current account deficit) will not trigger an immediate jump in the “spot” risk premia, but a slow and progressive increase as investors are progressively more demanding to absorb the rising stocks of securities. There is a big question mark on the financial markets’ ability to accommodate in a smooth way this sort of long-term trend, and we’ll come back on that when we’ll discuss what drives the “embedded” risk premia.
Expectations surveys provide a way, albeit imperfect, to track these “spot” risk premia’ changes as discussed briefly here (The Four Risk Premia). For example, in the case of the $/€ exchange rate, expectations surveys point to a “spot” risk premia having moved in a very large range: it looks like investors were expecting a short-term excess return of close to 10% (annual rate) when they were investing in the very weak dollar in the mid-1990s while symmetrically they needed an expected return of the same order of magnitude to invest in euros a few years later (with an euro as weak as 0,83$ in October 2000)7. A very interesting point is that the FX market had indeed some difficulties during these episodes of high risk “spot” premia to find its equilibrium. In the early 1990s, central banks had to support the dollar (despite private investors expecting a very high short-term return on the US currency) and in the year 2000, they had to intervene to prop-up a surprisingly weak euro.
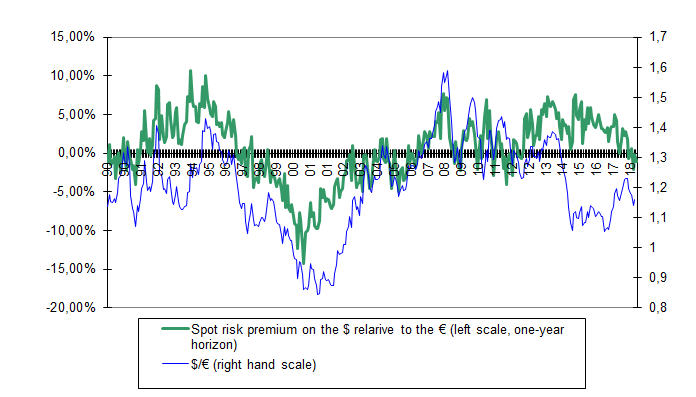
Source: Risk Premium Invest, based on exchange rates forecasts provided by “Consensus Economics”.
Writing the precise story of these 30 years of “spot” risk premia is not easy, but many movements can be clearly related to the previous factors (specific worries concerning either the US or the eurozone, the increase of the US foreign debt, the tendency of European companies to invest outside Europe at the time of the euro creation…).
Why the “valuation” risk premia vary…. or not!
As explained here, the “valuation” risk premia are the risk premia which are used by fundamentalist investors to value financial assets. The “valuation” risk premia should be related but not identical to the “spot” risk premia. The current price of any financial asset should be such that it allows current and future investors to receive the right return considering the risks they support. Thus, as for all the inputs which enter valuation models, there should be a strong forward-looking component in the “valuation” risk premium: it should be a sort of weighted average of how analysts expect the “spot” risk premium to behave in the future.
Thus, one would expect analysts to start first by an assessment of where the “spot” risk premia are currently standing based on various indicators (expectations surveys, theoretical models, “historical” risk premia…) and then to discuss its future direction. A key question should be to determine whether it is reasonable to suppose a “mean-reverting” return to the “historical” risk premia or whether there are good reasons to expect structural breaks (due to new correlations, supply or shift in investment patterns…).
In other words, the “valuation” risk premia should change if the “spot” risk premia appear to move in a surprising direction and that there are some good reasons to expect the new trend to continue for a while.
Yet, few investors seem to follow this time-consuming process. Most fundamental discussions of asset prices are based on a rather static view of the “valuation” risk premia and the use, implicit or explicit, of the “historical” risk premia. It is nevertheless true that sometimes analysts reckon the limits of the “historical” risk premia and discuss a structural break as a possibility. For example, there were many discourses about structurally lower risk premia for equities in the late 1990s and, currently, many analysts defend the idea that lower risk premia could hold down long-term interest rates.
In some way, the “valuation” risk premia used by analysts are not completely rigid. But what we see currently and what we have seen at the end of the 1990s, is that in general fundamental analysts change their view of the “valuation” risk premia only when they are forced to do so by market forces. When assets’ prices are moving for too long away from their estimates based on usual relationships, fundamentalist analysis eventually capitulate and revisit their assumptions concerning the right “valuation” risk premia.
In other words, the market tail is seemingly wagging the dog: changes in the “embedded” risk premia have necessarily sooner or later some impact on the fundamental valuation models used by analysts.
It is not very clear why fundamental analysts tend to fall behind the curve and may receive a wake-up call from the markets. It seems that most analysts are not aware of the volatility of “spot” risk premia and how some structural breaks feed back sooner or later into the “embedded” risk premia. Maybe, we need a bit more academic studies on this topic…
Yet, there is also a more general problem of incentives in a situation where most fund managers are judged against some tight benchmarks and cannot afford to underperform for long. In such a situation, it is not very useful to have better tools than others if you are the only one and the market ignores fundamentals for a rather long period. In other words, if the market is the special “beauty contest” described by Keynes in a famous metaphor, you have little incentives to study the long-term fundamentals. This is true for the dynamic of “spot” risk premia, as it is for the long-term profits or the long-term trends in monetary policy.
Why the “embedded” risk premia vary?
This is the final question, the most difficult to answer and probably the most important for the majority of investors!
As explained in The Four Risk Premia, the “embedded” risk premium is the excess return that an investor can reasonably expect over the long-term by buying a risky asset at the prevalent market prices. To estimate these “embedded” risk premia, investors need a scenario on the long-term returns available on various assets (i.e. a scenario on profits, monetary policies, equilibrium exchange rate).
Let’s take for example the case of the equity market. Let’s suppose that equities have a dividend yield d and that the economy, profits and dividends are all supposed to grow at the rate g. In the long-term, investors may expect a return g+d as the share prices will grow like the economy and investors will get the dividends on top of these capital gains. In this very simplified case, if risk-free interest rates are stabilized at r, the “embedded” risk premium will be g+d-r. In this rather simple case, the estimation of the “embedded” risk premium depends on one and only one parameter: how the economy and the dividends will grow in the long term (as r et d are directly observable)?
The “embedded” risk premium is (or should be) a key input in the asset allocation process of any investor with a long-term horizon (see Risk Premia Investing). Taken together the “embedded” risk premia determine what is called the “strategic asset allocation”, i.e. how a long-term investor would allocate his portfolio based only on expected long-term returns when he has no special idea on the short-term markets’ dynamics.
A very interesting question, that keeps us busy at Risk Premium Invest, is whether it is possible to extract the “embedded” risk premia by using purely quantitative models that avoid doing some rather complicated specific in-house economic work on the long-term fundamentals? In other words, is it possible to extract directly from observable market prices what thousands of other investors expect as far as the fundamentals are concerned (again profits, monetary policy…) and, as a sort of residual, the risk premia “embedded” in the current prices?
There is one fundamental reason why this investor’s dream may seem accessible. Inside an asset class, there are often many securities with different risk characteristics: in the equity market a few thousand companies, in the government bond market many maturities from very short-term bills to, in some countries, perpetual securities. As they are not all equally sensitive to the “embedded” risk premium of the asset class, the discrepancy of prices may hopefully give some rich information (i.e. an abnormally low price for a security sensitive to the risk premium may reveal that this risk premium is high).
We give a bit of information on our work concerning this approach when we discuss our proprietary Yield Curve Model. Let’s say simply that there is no miracle: these models may indeed help extract the “embedded” risk premia (and we are very open to academic collaborations on this issue!) but they cannot function without some sort of input concerning the investors’ expectations. There is what econometricians call an “identifiability” problem which is not always well recognized in the literature on this topic.
In any case, whatever methods are used to extract “embedded” risk premia, there is no doubt that they vary a lot (with again some considerable implications as far as assets allocations are concerned!). As far as the government bond market is concerned, our model shows that 50% of the 10-year rate’s variations may be coming from changes in the “embedded” risk premium. As far as the equity market is concerned, the long-term investor cannot reasonably expect over a 10 or 20 years period the same return while investing in the US market with a S&P500 index at 676 (March 2009) or four times more expansive at 2931 (September 2019). Last but not least, buying cheap dollars at 1,59 $/€ (July 2008) does not provide the same long-term expectations of gains than buying them at 0,83 $/€ (October 2000).
Why these “embedded” risk premia vary so much? It would be nice to have an answer since a significant part of the changes in market prices come from changes in “embedded” risk premia. A good understanding of the “embedded” risk premia’ dynamics would help making the right short term tactical decisions8. Unfortunately, there is no clear answer to this question.
Yet, as it should be clear from the preceding part on “valuation” risk premia, we don’t buy the story that modern markets are efficient pricing mechanisms where the “embedded” risk premia would provide, as they should, the most reasonable estimates of what actual and future investors will need as excess return on various assets classes. On the one hand, it is hard to reconciliate the “efficiency” theory with the large changes of asset prices unrelated to any kind of fundamental news (see for example the sharp fall of the equity markets in October 1987). On the other hand, it’s indeed hard to imagine that with so little studies and discussions on the complex dynamic of the “spot” risk premia, the markets would be miraculously able to find the right price9.
Markets are extremely complex mechanisms and the pricings they provide result from the interactions of a very large number of participants with rather different time horizons and investment approaches. There are two stabilizing forces. Firstly, we need to acknowledge the help coming from true long-term investors unconstrained by benchmark who try to extract from current prices a reasonable assessment of the embedded risk premia and act accordingly. Due to the tyranny of benchmarks, this is unfortunately a threatened species… Secondly, some stability and rationality could be also brought-in by those short-term investors who base their arbitrages on fundamental models to assess whether the embedded risk premia are sustainable. The share of these short-term “fundamentalists” vary a lot and very often they disappear when there are the most needed, i.e. when markets seem to evolve in uncharted territories. There are two possible explanations for the weak stabilizing power of short-term “fundamentalists”:
Too many irrational investors…
It may be that too many irrational investors drive some markets in “bubble” zones (for example by extrapolating naïvely some past trends or by forming completely inaccurate expectations on some fundamentals as profits). It may be that these irrational investors are too numerous to be contained by the “fundamentalists” with a limited fire power, and as a result the latter have sometimes to capitulate.
… or naïve fundamentalists?
It may also be that the “fundamentalists” are simply wrong and, in particular, used sometimes inappropriate “valuation” risk premia (see in particular how we analyze the recent history of the bond market in Has the Duration Risk Premium Turn Negative?). When they realize their mistake, they lose confidence in the accuracy of their models and stop trying to stabilize the market.
What are the options when you are a short-term rational investor and you lose confidence on the fundamental valuation models? It is very likely that you become an active participant in the short-term special “beauty contest” well described by Keynes! In other words, you try to second guess what other investors are likely to do in the coming few days or months, joining for example the ranks of “chartist10” and “contrarian11”.
The two previous explanations are not mutually exclusive: mispricing in financial markets, i.e. the appearance of abnormal “embedded” risk premia, probably come both from the presence of irrational investors and from the difficulties faced by fundamentalist to react correctly when “spot” risk premia change.
At the end of day, there is little doubt that when the “spot” risk premium on a specific asset is stabilized at a new level, sooner or later the prices will take into account this new level and the “embedded” risk premium will adjust. Markets cannot stay inefficient for decades! But due to the capitulation of fundamentalists and the rising role of “chartists” and “contrarians” the process may be rather chaotic. This point is discussed in much more details in this old paper on The Role of Transparency For a Better Princing of Risk (see appendix 2).
Why the “historical” risk premia vary?
This is probably the easiest question…
The changes in the « spot » risk premia are also driving the “historical” risk premia. Over long period of times, it is difficult to believe that investors could be systemically wrong and that realized returns could be biased on the positive or negative side relative to the returns they were expecting ex ante. Thus, over four or five decades, it is not unreasonable to believe that “historical” risk premia provide an estimate of where the “spot” risk premia were standing on average over this period. But in a world of changing “spot” risk premia, this backward-looking information is probably not very useful.
And, unfortunately, the link between “spot” risk premia and “historical” risk premia can be very counter-intuitive over shorter periods. The immediate impact of a lower “spot” risk premium on a specific asset is to boost its price and as a result, its observed “historical” risk premium will rise before falling! This initial impact will be particularly strong and lasting if:
- Markets are efficient. In other words, prices move more if the change of “spot” risk premium is correctly identified and fully integrated into both the “valuation” risk premium used by analysts and the “embedded” risk premium.
- The asset provides long-term pay-offs. For example, the price of equities is based on the discounting of dividends very far into the future. A change of risk premium will have a large impact and “historical” risk premia may send a wrong signal for many years. Symmetrically, the short-term impact of a change of risk premium will be much smaller on a one-year bond. Thus, an “historical” risk premium based on only 10 years of data may give some preliminary indications on where the “spot” risk premium is standing for one-year bond, while it will be completely misleading as far as equities are concerned.
On top of this rather perverse relationship between actual “spot” risk premia and “historical” risk premia, the latter are also impacted by unexpected shocks on other fundamentals (profits, monetary policies…) which may compensate each other over 50 years but are not necessarily symmetric over a 10 or 20 years period. All in all, it’s better to avoid putting too much weight on “historical” risk premia in the investment process!
- In the CAPM, the “spot” risk premium on a specific asset is β x the “market risk premium” with
 . The “spot” risk premium of a specific asset depends on its relative volatility,
  , and its correlation with the market,
  .
. - In this graph, the correlation between bonds and equities is estimated at each date on the basis of the previous 52 weekly returns.
- If financial crisis generally lead to a negative correlation between bonds and equities, the years 1993 and 1994 were an exception. There was a panic in the bond market after the US federal reserve rose its target for interest rates and the equity market was negatively impacted. This two-year spike in the correlation appears in the graph.
- In this graph, prior to the year 1999, a synthetic euro is estimated based on a basket of European currencies.
- This common sense observation is implicitly part of the CAPM model: a very large asset class will represent a significant share of the total market of risky assets and a result there will be mechanically a positive correlation (positive β) between the return on this asset and the total average return of the whole market.
- When a country is indebted, there is no way to avoid that some investors (domestic or foreign) support the exchange rate risk. It can be borne by foreign lenders if they buy securities denominated in the local currency or it can be borne by domestic agents if they issue debts denominated in the foreign currency to benefit from lower interest rates (the situation seen in many emerging countries).
- In this graph, the spot risk premium on the $ relative to the euro is estimated using the expected exchange rate one-year ahead (the source is “consensus economics”), and taking into account the “carry” (i.e. the difference between one-year interest rates in the US and in the eurozone). Prior to the introduction of the euro in 1999, data from Germany are used (both for interest rates and for the exchange rates, with the 1,95583 DM/€ conversion rate used in the graph).
- Being able to extract the level of the risk premia help to make the right choices as far as strategic asset allocations are concerned. Being able to forecast the changes in risk premia help to make the right choices as far as tactical asset allocations are concerned.
- Obviously, some academic would object that a market may be able to aggregate efficiently the preferences without the need to make these preferences explicit. In other words, you don’t need to have many studies to balance supply and demand, you need only to have buyers and sellers active in the market! The only problem with financial markets is that they are what economists call “incomplete”. For example, all the public debt which will be issued next year is not already sold forward to investors who would commit themselves. Thus, the future “spot” risk premia that we’ll be necessary next year to balance the market is not traded anywhere. From a pure theoretical point of view, it is because financial markets are incomplete that we need to inform the current market participants with studies on actual and future “spot” risk premia.
- The « chartists » believe that there are trends in financial markets and that these trends can be spotted by looking at the past behavior of market prices.
- The « contrarians » believe (rightly!) that investors may find difficult to keep very large short-term tactical positions relative to their benchmarks. Thus, they tend to sell popular assets where there are signs other investors are too much invested.